
CINEBENCH - R11.5 SINGLE CORE
3
of Total Submissions
3.07 pts
of Total Score
Thursday, 01 January 1970 07:00:00 | Updated at 1 month ago
About Cinebench - R11.5 Single Core
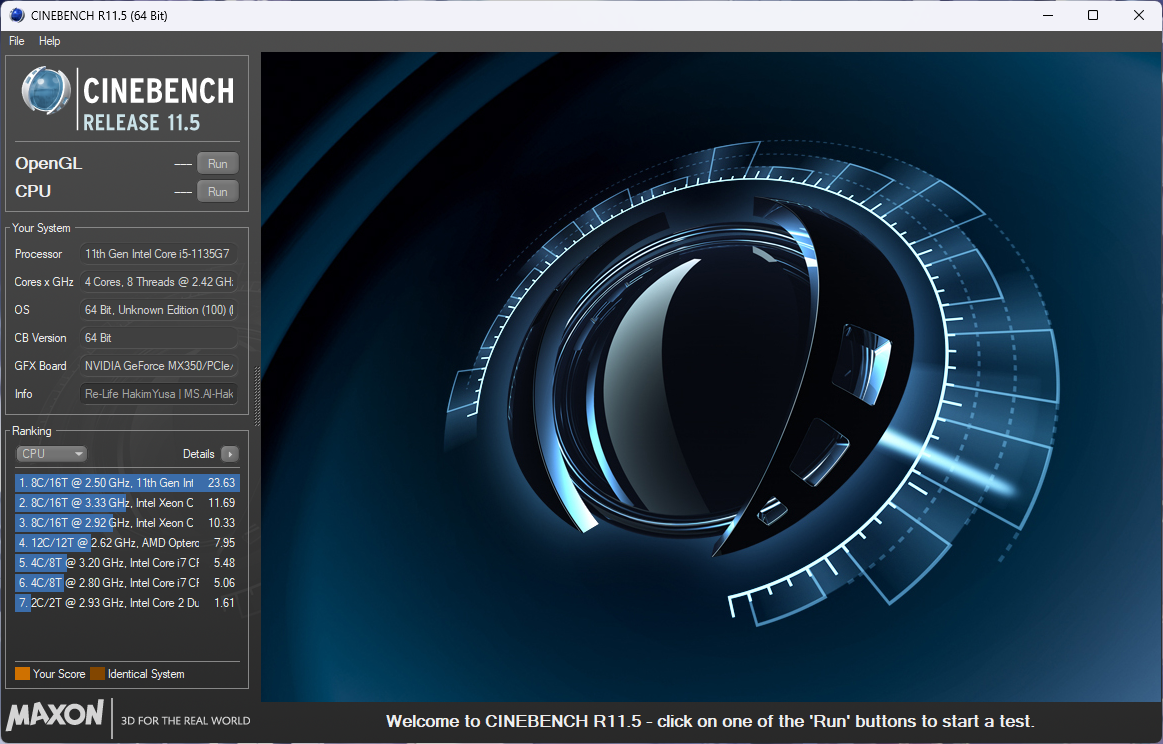
The test scenario uses all of your system's processing power to render a photorealistic 3D scene (from the viral "No Keyframes" animation by AixSponza). This scene makes use of various different algorithms to stress all available processor cores.
In fact, CINEBENCH can measure systems with up to 64 processor threads. The test scene contains approximately 2,000 objects containing more than 300,000 total polygons and uses sharp and blurred reflections, area lights and shadows, procedural shaders, antialiasing, and much more. The result is given in points (pts). The higher the number, the faster your processor.
Benchmark Cinebench - R11.5 Single Core Chart Ranking
The following graph displays the hardware performance ranking based on benchmark results using Cinebench - R11.5 Single Core. The data is organized from highest to lowest score for easy visual comparison between devices. You can hover over each bar to view the score details and associated hardware name.
Benchmark Cinebench - R11.5 Single Core Table Ranking
The following table presents hardware rankings based on benchmark results using Cinebench - R11.5 Single Core. The table format provides detailed views such as device name, score, number of submissions, as well as links to test results. It's perfect for those who want to see detailed data and easily search or filter.
| No. | Hardware | Submissions from Cinebench - R11.5 Single Core |
|---|---|---|
| 1 | Intel Core i5 1135G7 | 2.19 pts |
| 2 | Intel Core i7 720QM | 0.60 pts |
| 3 | AMD E1-1200 | 0.28 pts |